
Golf Course Form Guide: How to Research a Tournament Before You Bet
 Available in US
Monday morning, the tour schedule updates, and you have until Thursday morning to build a credible analytical case for the players you want to back. That is roughly 72 hours, and most of it will be wasted if you do not have a structured research approach. I have watched punters spend three hours reading player interviews and press release quotes from a tournament preview, then commit real money based on atmosphere rather than evidence. The interview where a player says he “really loves this course” is marketing content, not analytical signal. The 72 hours before a tournament start are enormously productive if you know exactly where to look and what to prioritise.
This guide is a step-by-step research framework built around the specific information that actually predicts golf tournament outcomes. Not the information that sounds good on a preview podcast. Not the narrative around a player’s “confidence levels.” The measurable, repeatable data points that consistently distinguish competitive contenders from field-fillers in a 156-person starting list.

Why Course History Is Not Enough on Its Own
There is a particular kind of social media golf tip I encounter every week without fail: “He has won here before, he loves this course.” It is the most persistent form of lazy analysis in golf betting and one of the most consistently misleading. Yes, course history matters — but it matters far less than most punters believe, and it is almost always misapplied.
The most obvious problem is sample size. Even a player who has played a given course eight times has a statistical sample too small to draw reliable conclusions from, particularly when you factor in how dramatically courses change year to year. Grass types get replaced. Routing adjustments are made. New tee placements change the required shape of approach shots. A player who thrived at Augusta in 2019 on a rain-softened course may be playing an almost entirely different examination in 2024 on firm, fast conditions. The winner’s circle from five years ago tells you very little about who will contend this year when the course is playing 15 strokes harder.

There is also a more subtle issue: elite players win at multiple venues precisely because their general level of excellence overpowers course-specific variables. When a top-five player in the world wins at a course, the takeaway is often less about course fit and more about the fact that the best players in the world tend to win tournaments. Attributing their victory to course affinity, then using that to project future performance for the same player three years later, requires an analytical leap that the data does not support.
Course history is one input among many, and it needs weighting with appropriate humility. A player with three top-tens at a specific venue in the last four appearances has demonstrated something meaningful — specifically, that their game profile holds up on this track even in varying conditions. That is worth incorporating. But raw historical wins from five or more years ago, without checking whether the player’s current game profile still matches the course demands, is how you make confident selections that have no analytical foundation.
Key Metrics to Research Before Any Tournament
I was reviewing form guides with a fellow analyst a few seasons ago and he described his approach as “building a case for the prosecution” — assembling multiple independent data points that each point in the same direction. One metric is an observation. Three metrics aligned is an argument. That framing has stuck with me because it captures exactly the right epistemological standard for this kind of research.
Scoring average is the most direct measure of a player’s current competitive output. Not their career average — their rolling average over the last eight to twelve tournaments, expressed as strokes above or below par per round. A player posting scoring averages consistently below the field mean is performing. One posting scoring averages above the field mean is not, regardless of what their ranking or reputation suggests.
Greens in Regulation percentage (GIR%) measures the proportion of holes where the player finds the green in the expected number of strokes or fewer. This is a direct proxy for ball-striking quality and approach play reliability. A high GIR% on courses that penalise missed greens — where runoff areas, deep rough or severe slopes around the green make recovery shots expensive — is one of the most powerful course-fit indicators available. The PGA Tour publishes GIR% data broken down by approach distance, which lets you check whether a player’s green-finding rate drops at the specific yardages that dominate the course you are researching.

Cut rate is underused in most research processes I observe, and it is genuinely valuable for identifying consistent competitors. A player who makes 80% or more of cuts over their last 20 starts is demonstrating the baseline consistency required to contend across four rounds. Cut rate eliminates from your shortlist the volatile players who occasionally fire low rounds but regularly disappear on moving day. In a sport where variance is high, backing players with strong cut rates improves your probability of your selection remaining in the field through the weekend — a prerequisite for any place return.
Bogey avoidance rate — sometimes presented as “bogey-free round percentage” or simply “worst-round scoring average” — captures a player’s ability to limit damage on bad holes and bad days. Tournament golf at the highest level is as much about protecting against blowup rounds as it is about shooting low numbers. A player with elite scoring ability but a pattern of occasional 75s or 76s is a much higher-variance proposition than one whose floor is consistently solid even on off days. For each-way betting, where you need a player to sustain performance across all four rounds rather than simply catching fire for one, bogey avoidance is a specifically relevant measure.
Top-ten rate over the last 24 starts is the summary metric I use as a final sanity check. If a player’s underlying stats — GIR, scoring average, bogey avoidance — suggest they should be finishing in the top 15 of any field where they compete, but their actual top-ten rate is well below that expectation, there is a discrepancy worth investigating. Persistent underperformance relative to underlying metrics often signals something the stats are not capturing: a tendency to wilt on the final nine of a close Sunday, a pattern of making poor strategic decisions under pressure, or simply the kind of mental resilience gap that data cannot measure. As a tip from Barry at Golf Monthly once framed it with characteristic directness, following trends rather than simply backing talent is what produces long-term results — and top-ten rate is where trends either confirm or contradict the narrative.
Environmental Factors: Wind, Rain and Course Conditioning
I have backed players into tournaments I was convinced they would contend, only to watch them obliterated by weather conditions that transformed the course into something entirely different from the track the historical data described. It is a humbling experience, and it is preventable with the right preparation.
Wind is the most transformative single variable in professional golf. A links course in calm conditions plays almost nothing like the same course in 25-knot winds. Approach distances effectively increase by 20 to 40 yards depending on direction. Players who rely on high-trajectory iron play are punished severely. Driving accuracy becomes critical where driving distance is normally the advantage. The result is that the SG profile of your ideal candidate changes based on the forecast wind speed and direction for each round. Checking the AccuWeather 7-day forecast and the venue’s typical wind patterns — available from tournament historical data — should be part of every research session from Wednesday onwards.

Soft versus firm course conditions produce equally dramatic changes in playing character. A firm, fast Augusta is a different examination from a rain-softened one — approach shots that would release off a firm green now stop dead, changing the advantage of specific distance profiles. Firm conditions generally reward low ball-flight, bump-and-run creativity, and the ability to use the ground as a tool. Soft conditions reward precision iron play with stopping power, favouring players whose SG:APP numbers come from hitting greens from distance rather than running the ball onto them. Knowing which is likely for the coming week — and whether the course has drained well after recent rain — shapes which players are worth targeting.
Course conditioning beyond just the weather includes rough length and density, green speed, and whether fairway firmness has been deliberately manipulated by the tournament committee. Major championships are set up with specific agendas — the USGA notoriously firms and lengthens rough to challenge driving accuracy, while The Open Championship committees tend to soften rough in wet conditions to protect scoring against brutal winds. Following the tournament’s official course setup notes, usually published mid-week, gives you information that the market may not have fully absorbed yet. For more detail on how wind and rain specifically shift market efficiency and which player profiles benefit most from each condition type, the weather conditions guide covers this in dedicated depth.
Reading the Field: Strength of Field and Market Signals
Not every 156-player PGA Tour field is equally competitive. Some tournaments draw near-full strength fields including the world’s top 50 players. Others, particularly smaller-purse events and those that clash with DP World Tour flagship tournaments, see a significant number of top players resting or competing elsewhere. This variation in field strength has a direct and often underappreciated impact on each-way value.
In a weak field, the concentration of elite talent is lower, which means lower-ranked players have a higher probability of finishing in place positions that would be out of reach in a stronger field. A player ranked 120th in the world faces a different challenge in a field average-ranked 80th than in one average-ranked 40th. Market prices do not always fully account for this distinction, particularly mid-week when odds are set early in the week relative to the announced field. If a player who would be a 25/1 shot in a top-strength field is priced at 25/1 in a notably weaker draw, their implied place probability is understated.
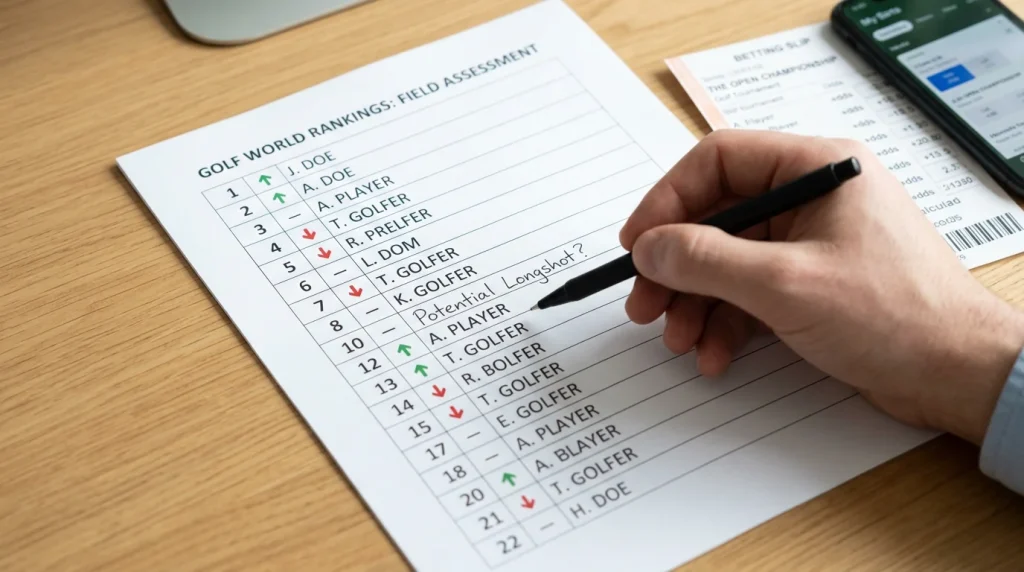
The World Golf Rankings provide a direct tool for field quality assessment. Before each event, the Official World Golf Ranking standings let you check how many top-50, top-100 and top-200 players are entered. A field with only four of the top 50 in the world is a meaningfully easier competitive environment than one with 18 of the top 50. Adjusting your assessment of a player’s finish probability in light of this context can identify mispricings that exist purely because the bookmaker’s opening odds were set relative to a player’s general market position rather than their specific competitive strength relative to this particular draw.
Market movement — the direction and speed of odds changes from opening prices to the start of play — provides a secondary signal worth monitoring. When a player shortens significantly between Wednesday evening and Thursday morning, informed money is moving on them. This is not a reason to blindly follow the steam, but consistent pre-tournament price compression on a specific player, particularly when it does not correlate with any news or injury update, often reflects sharp bettor consensus about course fit or form that may not yet be reflected in public analysis. Conversely, a player drifting in the market despite strong statistical credentials sometimes indicates injury rumours or late course information that has reached sophisticated operators before becoming public. Treat market signals as one additional data point in the framework, not a replacement for the underlying research.
Building Your Tournament Research Template
The gap between knowing all of this in theory and applying it consistently every week comes down to having a repeatable structure that does not require starting from scratch each Monday. I built my research template over several years of iterating on what actually changes my selection decisions versus what I was checking out of habit without it affecting my thinking. What follows is the stripped-down version — the questions I find genuinely decision-relevant.
Start with the course. What is the track demanding this week? Identify the top two SG categories most rewarded by the design and typical setup. Is this primarily an approach play examination, a ball-striking distance event, a short game and scrambling test, or a combination? Note whether the course setup is expected to be firm or soft, and whether the routing is particularly exposed to wind from a dominant direction. This decision shapes every filtering choice that follows.
Move to the field. Who is actually playing? Note the world rankings of the top 20 starters and compare to a typical strong-field event. Is this a weaker or stronger week than average? If weaker, which players currently priced between 16/1 and 40/1 are competitive enough that a weaker field represents a genuine opportunity for them to contend? A player ranked 90th in the world faces a radically different competitive examination in a field missing 15 of the top 50 than they would in a flagship event.
Apply the SG filter. Pull the rolling 20 to 24-event averages for the primary and secondary SG categories you identified in step one. Find the top 25 to 30 players in the field for those specific categories and treat that group as your shortlist candidates. Discard the rest of the field from active consideration at this stage — you will return to them only if the shortlist produces too few viable betting options at the available prices.

Check recent form. For each candidate, review their last eight tournament results. Have they made cuts consistently? Are there patterns of weekend fades or strong Thursday-Friday performances followed by deflating weekends? Do their finishing positions align with their round-by-round scoring, or are there repeated instances of being in contention only to fall away? This is where you either confirm or disqualify the statistical profile with recent performance evidence that the SG data alone cannot capture.
Overlay course history. Within the candidates still on your shortlist after form review, identify those with positive records at this specific venue in the last three to four years — top-20 finishes, above-average cut rates, or strong SG numbers in previous appearances even when the overall result was not spectacular. Strong course history combined with strong current form is the most reliable configuration. Discount course history from more than five years ago unless you have specific reason to believe the course has not changed and the player’s game has remained stable.
Check the forecast. Wednesday and Thursday morning weather for the opening round can be decisive on links courses and in late-autumn tournaments. A wind forecast above 20 mph changes which player profiles are most advantaged. Identify whether the expected conditions suit or actively conflict with the game profiles of your remaining candidates. A player whose SG profile is built on high-trajectory iron play entering a links event in a 25-knot wind deserves significant discount regardless of how strong their statistical case looks in calm-conditions data.
Compare against odds. For each player still on the shortlist, calculate the implied probability in their current each-way odds at the best available place terms. Compare that implied probability to your own estimate based on the totality of the research above. Where your estimate significantly exceeds the implied probability — particularly in the 16/1 to 40/1 range — you have a candidate worth backing. Where the market price appears accurate or generous to the bookmaker, pass and move on.
This process takes between 45 minutes and two hours depending on how much SG and form data you need to pull, and it consistently produces a focused shortlist of three to six candidates with a clear analytical justification for each. The discipline of following the framework — and only backing players who pass it rather than adding selections based on instinct — is what converts this from a research exercise into a repeatable betting edge.
Frequently Asked Questions
How far back should I look at a golfer's course history?
For recent course history, four to six previous appearances is the practical window — enough to identify a genuine pattern without being distorted by conditions or course setups that no longer apply. Appearances more than five years old carry little weight unless the course and player profile have remained essentially unchanged. Always check whether the course has undergone significant modifications, green re-surfacing or routing changes that would make older results less comparable to current conditions.
Which stats matter most when researching a links course?
On links courses, SG: Off the Tee and SG: Around the Green take on greater importance than on parkland courses. Wind conditions reduce the reliability of approach distances, making ball-striking control off the tee more predictive. SG: ARG captures the scrambling quality that becomes essential when bump-and-run play and awkward runoff lies dominate. Bogey avoidance rate is also particularly valuable on links tracks where a single poor hole can cost several shots more than on a more forgiving parkland layout.
Where can I find free golf tournament research data?
The PGA Tour official statistics portal provides free access to SG data for all four categories, GIR percentages, scoring averages and cut rates. DataGolf covers DP World Tour events using the same methodology and has a free tier sufficient for weekly research. The DP World Tour statistics section provides supplementary European data, and AccuWeather is the most reliable source for the 7-day forecasts relevant to wind and rain conditions for the coming week.
Does recent form or course history carry more weight in golf betting?
Recent form carries more weight in most situations, particularly when the recent form window is 20 or more starts. Course history is most valuable when it is recent (within three years) and when the player has multiple appearances showing consistent course fit across different conditions. When recent form and course history point in opposite directions — a player in strong form but with a poor course record, or a player with a great course record but current poor form — recent form should generally be the tiebreaker, as it captures the player's current skill level more accurately than historical results.
Articles
PGA Tour Free Picks
The paid tipster subscription industry exists because most people don't believe they can do this analysis themselves. Some of that…
Golf Betting Unlicensed Sites
Someone in a golf betting forum I follow shared their "secret" for getting better odds: they'd found an offshore site…
Mobile Golf Betting in the UK
The shift to mobile-first golf betting happened quietly but completely. I remember when placing a golf bet on your phone…
Golf Course Form Guide
The laziest analysis in golf betting is "he's won here before." The most sophisticated analysis acknowledges that course history matters…
