
Strokes Gained Golf Betting: How Data Separates Value Picks from Guesswork
 Available in US
Before Strokes Gained existed, golf analysis was essentially a collection of politely useless numbers. Putts per round. Greens in regulation. Driving distance. They told you something happened, but not whether it was good or bad relative to the competitive context. A player could average 29 putts per round and be a brilliant putter, or an average one who happened to miss greens and thus putt from closer range. The traditional stats obscured more than they revealed, and for years, golf betting was shaped more by narrative — the player who “looks in form,” the course that “suits his eye” — than by anything quantifiable.
What changed that was not a technology platform or a betting algorithm. It was a 2011 academic paper from Columbia University. Professor Mark Broadie spent years developing a methodology that compared every shot in professional golf to a baseline of what a tour-average player would be expected to do from the same situation, on the same grass, at the same distance. The result was Strokes Gained — a framework that finally made it possible to isolate which players were genuinely outperforming the field and in which specific parts of their game. For golf bettors who learn to use it properly, this shift from narrative to data is the single most powerful edge available in the market today.

The Origin of Strokes Gained: Columbia, Broadie and ShotLink
Most analytical frameworks in sports betting emerge from the bottom up — a few sharp bettors notice patterns, build informal models, and eventually their methods get formalised. Strokes Gained took the opposite path. It began in academia, was adopted by the PGA Tour as an official metric, and only later did serious bettors realise what they had been handed.
Broadie’s work at Columbia University drew on the PGA Tour’s ShotLink database — a system that tracks every single shot hit by every player at every Tour event, recording location, distance from the hole, lie condition and outcome. By 2011, ShotLink contained millions of data points built up over years of laser-measured tracking across thousands of professional rounds. Broadie used that dataset to calculate the expected number of strokes required to hole out from any given position on the course, across every surface type. That baseline — sometimes called the “tour average” from a specific location — is what Strokes Gained measures against.

If a player hits an approach to six feet from 175 yards, and the average tour player from that same 175-yard position requires 2.87 strokes to hole out, then holing that approach in one stroke gains 1.87 strokes compared to the tour average. If instead the player misses the green and leaves themselves 40 feet from the flag, from a position where the average requires 2.87 strokes, and the player now faces a situation requiring on average 2.15 strokes to hole out, they have lost 0.72 strokes on that single shot. Every shot is evaluated this way, every round, every tournament. The result is a comprehensive picture of who is genuinely outperforming expectations and in which part of their game.
Today the DataGolf platform, which builds on Broadie’s methodology, contains more than 2.1 million records of professional matches and results across male and female tours from the USA, Europe and Japan. That scale of data is what makes Strokes Gained reliable as a predictive tool rather than a descriptive curiosity — a large enough sample to strip away variance and reveal genuine skill differentials. For bettors, the shift this represents is fundamental: you are no longer guessing which player “looks sharp” based on last week’s highlights. You are comparing objectively measured performance contributions against a stable baseline, across a meaningful sample of competitive situations.
The Four SG Categories Explained
If you have spent any time on golf betting sites or analytics platforms, you have likely seen references to SG stats without a clear explanation of what each category actually captures. The four divisions exist because the game’s distinct phases — driving, approach play, the short game and putting — have very different levels of predictive power for future performance, and treating them as a single lump measurement loses crucial information.
SG: Off the Tee (SG:OTT) measures performance from the tee on par fours and par fives. This is primarily about driving distance and accuracy — how far a player hits it and how reliably they find the fairway. Strong performance here creates advantageous positions for approach shots. SG:OTT has moderate predictive power: players who gain consistently off the tee maintain a genuine advantage on courses where length is rewarded, but driving performance fluctuates more shot-to-shot than approach play because of the inherent variance in hitting from a standing start with a driver.
SG: Approach (SG:APP) is the category I weight most heavily in my weekly selection process, and the data strongly supports this prioritisation. SG:APP measures the quality of approach shots from any distance outside the green — typically from 50 yards to over 250 yards. A player who consistently gains on approach is creating birdie opportunities at a higher rate than average while avoiding the bogey situations that destroy tournament scoring. Multiple analyses of Major winners from 2017 to 2025 show that a high proportion of top finishers at Augusta and other demanding venues ranked above +1.0 SG:APP for the event. As one detailed course analysis framed it: approach play is the most predictive metric because it directly creates birdie opportunities, and players who consistently gain strokes on approach tend to outperform over time even when short-term putting results fluctuate. Putting variance — the category most visible to casual observers — is a notoriously unreliable predictor of future performance. SG:APP is not.

SG: Around the Green (SG:ARG) covers all shots from within 50 yards of the flag that are not on the putting surface. This encompasses pitches, chips, bunker play and tight lies around the green. SG:ARG has moderate-to-low predictive reliability over short periods but becomes meaningful across longer samples. Players who consistently lead this category tend to save a disproportionate number of scrambling situations, which helps them survive the down days that eliminate players with fragile short games from contention.
SG: Putting (SG:P) is the most volatile of the four categories and the least reliable predictor of future performance. Putting streaks — hot weeks where everything drops, or cold spells where nothing does — are the most common source of short-term SG:P variance. Bettors who chase players coming off exceptional putting weeks, assuming the form will continue, are targeting the category with the poorest forward-looking signal. A player leading the field in SG:P for a given tournament is more likely to regress towards their mean the following week than to sustain that output. This does not mean SG:P is useless — a player with a strong long-term SG:P average has a genuine edge — but week-to-week SG:P spikes are largely noise.
The practical application of these four categories starts with the course. A long, firm parkland course that demands precise approach play from challenging distances calls for a very different SG weighting than a soft links course in wet conditions where SG:ARG and scrambling ability may matter more than SG:OTT from elevated tees.
Course Fit and SG: Matching Stats to Track Profile
The single most common mistake I see in data-led golf betting is treating SG statistics as generic — as if the category that matters most at Augusta is the same as the one that matters most at a rain-softened links course with a diminished premium on distance. It is not. Course fit is not a vague qualitative concept; it is the process of identifying which SG categories are most amplified by the specific design and conditions of the track in question, and then finding players who lead the field in exactly those categories.
Augusta National is the clearest example of SG:APP dominance in course profiling. The course’s second shots — from tight, sloping lies to heavily contoured greens — demand extraordinary precision on approach. Players who struggle to hit targets from 150 to 200 yards simply cannot compete at Augusta regardless of how well they drive the ball or how hot their putter runs that week. The statistical pattern here is consistent: high SG:APP performance from competitors who have played Augusta multiple times strongly correlates with top-ten finishes at the Masters. Using multiple seasons of ShotLink data, bettors who filter their shortlists to players above the tour average in SG:APP over their most recent 20 to 24 starts, and who have at least two previous Augusta starts, narrow the field to a competitive subset that has historically accounted for a disproportionate share of top-20 finishes.

Links courses in the British Isles — including the Open Championship rotation of Royal Liverpool, St Andrews, Royal Portrush and others — present a contrasting profile. Wind speed and direction fundamentally change the relative difficulty of approach shots, often making distance control off the tee more valuable than pure approach shot precision. SG:OTT performance becomes more predictive because ball-striking skill in difficult wind conditions is amplified by courses that demand creative shot-shaping and controlled flight. SG:ARG also rises in importance as bump-and-run play, awkward runoff lies and tight-but-fast greenside areas create scrambling opportunities that separate players with genuine imagination around the greens from those who rely on a high ball-flight that the wind punishes.
Short, tight parkland courses with receptive greens tend to suppress the advantage of SG:OTT because length off the tee provides less of a differential when most holes can be reached with a mid-iron regardless of driving distance. These tracks often elevate SG:P as a differentiator because when every player can reach every green, the scoring variance comes predominantly from putting quality rather than ball-striking distance. This does not mean chasing SG:P spikes — it means giving more weight to players with genuinely strong long-term putting averages when the course profile suggests putting quality will be heavily tested.
When I am profiling an upcoming event, I start by identifying the one or two SG categories that the course history most consistently rewards, then filter my player shortlist accordingly. The result is a much smaller pool of genuinely relevant candidates — typically eight to twelve players from a 156-person field — against whom I can evaluate each-way value with the specificity that the place market requires.
Where to Find SG Data: Free Tools and Paid Resources
One of the arguments I hear most often against using SG data is that it requires expensive subscriptions or technical expertise to access. Neither is true. The core data is available at multiple levels of depth and cost, and the free tier is entirely sufficient for most practical betting research purposes.
The PGA Tour’s official statistics portal publishes SG data for all four categories for all Tour events, updated in real time during tournaments and available seasonally as rolling averages. The data is searchable by player, by category and by time period — you can pull the last 24 events for any player’s SG:APP figures within two or three clicks. This is the primary free resource and the most authoritative source for PGA Tour events. Its limitation is that DP World Tour data is not included, which requires a separate resource.
DataGolf is the platform I use most consistently for serious pre-tournament research. It applies the same Strokes Gained methodology to the DP World Tour and several other global circuits, standardising performance across different competitive levels to produce what they call “adjusted” SG figures. The platform’s database of more than 2.1 million records means that even players with limited PGA Tour appearances have substantial performance histories that can be properly evaluated. DataGolf has a free tier that provides sufficient access for weekly research, with a paid subscription unlocking deeper historical comparisons and predictive model outputs. For the frequency of betting most recreational punters do, the free tier is the right starting point.
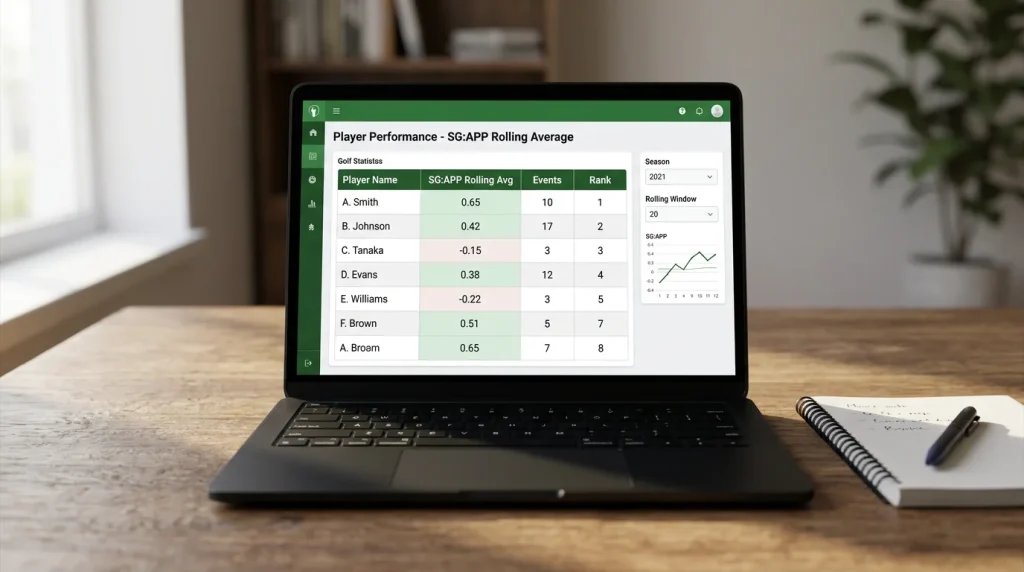
FantasyNational and Datagolf’s ranking pages both publish rolling SG averages in tabular form, which makes it quick to scan the top performers in specific categories for an upcoming week. When I am time-constrained, these summary tables let me identify the top-ten players by SG:APP or SG:OTT in the most relevant time window — usually the last 20 to 24 starts — in under five minutes. That is enough to build a credible shortlist before doing deeper comparative work on course history and form.
For DP World Tour events, the DP World Tour’s own statistics section has improved substantially in recent years, though it remains less granular than the PGA Tour equivalent. The gap is filled by DataGolf’s coverage, which is particularly important when betting European events where you may be evaluating players with limited PGA Tour history. The rolling average versus season total distinction is worth noting: a player’s rolling 24-event average captures current form more accurately than a full season total, which can be diluted by poor early-season results that the player has clearly moved past.
Building a Simple SG-Based Pick Shortlist
Theory without a practical framework is only half useful. What I want to share here is the actual process I follow each week to move from raw SG data to a focused shortlist of five to eight players worth considering for that specific tournament. This is not a mechanical algorithm — it requires judgment at each step — but it is systematic enough to be repeatable and disciplined enough to avoid the narrative-chasing that undermines most casual golf betting.
Step one is identifying the two primary SG categories that the course rewards most strongly, based on the course profiling principles covered in the previous section. This is a deliberate, course-specific decision that changes week to week. At a driving-emphasis venue like Augusta National or TPC Sawgrass, SG:APP is the primary filter. At a wind-exposed links course, SG:OTT and SG:ARG move to the front.
Step two is pulling the current rolling 20 to 24-event average for those primary SG categories for all players in the field. Filter for players who rank in the top 30 of the field in the primary category, and top 50 in the secondary category. This creates a performance-based subset of the starting field — typically 20 to 30 players — who have demonstrated the specific skills this course is most likely to reward.

Step three is overlaying course history. Within that SG-filtered subset, identify players with a positive record at this specific venue — top-20 finishes in previous appearances, made cuts at an above-average rate, or strong SG performance in prior rounds even when the final result was not spectacular. Players who perform well on course fit metrics but have a history of struggling at this particular venue deserve lower weighting.
Step four is checking form across the last eight starts. Has the player made recent cuts consistently? Any results dramatically better or worse than their statistical profile would predict? A player with strong SG:APP numbers who has missed four of their last six cuts is likely experiencing something not captured in the rolling average — injury, fatigue, swing change — and warrants caution despite the statistical profile.
Step five is comparing the resulting shortlist against the odds. Find the players in your filtered group whose market prices imply a finishing probability that your analysis suggests understates their realistic chance of contending. For each-way betting, the question is whether the place implied probability at the offered terms is lower than your estimate of their probability of finishing in the top six, eight or ten depending on the week’s terms. When that gap exists and the player sits between 16/1 and 40/1, you have identified a candidate worth backing.
This process consistently narrows a 156-player field to a workable shortlist of five to eight genuinely justified selections, which is the right size for meaningful each-way portfolio management without over-extending your stake across too many positions.
One additional calibration I apply at the shortlist stage: check whether the player’s SG profile is internally consistent or whether one category is carrying the others. A player posting strong overall SG numbers almost entirely on the back of an unusually hot putting week requires much more caution than one whose gains are distributed across approach and off the tee. The former is likely to mean-revert; the latter represents a genuine skill profile that the market may not have fully priced. Making that distinction takes an extra ten minutes of category-level analysis but often identifies the selections with the most durable value. For a deeper dive into how course history fits into this analysis, the golf course form guide expands on the specific metrics and research approaches that complement the SG-based shortlisting method covered here.
Frequently Asked Questions
What is the most important Strokes Gained category for golf betting?
SG: Approach (SG:APP) is the most predictive category for most course types and the one I weight most heavily. It directly measures birdie-creation ability and avoidance of bogey-inducing missed greens, both of which are strongly correlated with tournament contention. SG: Putting (SG:P) is the least reliable predictor week-to-week due to high variance, so chasing players coming off exceptional putting weeks is one of the most common and costly mistakes in golf betting.
Can I access Strokes Gained data for free?
Yes. The PGA Tour publishes full SG data for all four categories on its official statistics portal, free to access and searchable by player and time period. DataGolf provides SG coverage for DP World Tour and other circuits, with a free tier that covers the majority of practical research needs. Both sources update continuously during and after tournaments.
Does Strokes Gained work for DP World Tour events or only PGA Tour?
It works for both. The PGA Tour's ShotLink system is the primary data source, but DataGolf applies the same Strokes Gained methodology to DP World Tour events, standardising performance across different competitive contexts. The adjusted SG figures on DataGolf are particularly useful for evaluating European-based players who appear less frequently on the PGA Tour but have extensive DP World Tour records.
How many tournaments of SG data do I need to make a reliable assessment?
A minimum of 20 to 24 recent starts provides a meaningful rolling average that balances recency with sample size. Fewer than 12 tournaments and you are operating in noise territory where a single exceptional or poor performance distorts the picture. Longer windows — 36 to 48 events — provide greater statistical stability but can underweight recent form changes from equipment adjustments, swing work or fitness improvements.
Articles
Best Bookmakers for Golf Betting UK
After nine years placing golf bets across multiple UK accounts, I've developed strong views about what separates a genuinely useful…
Golf First Round Leader Tips
The FRL market is one of the most interesting bets in golf — and one of the most frequently misunderstood.…
PGA Tour Free Picks
The paid tipster subscription industry exists because most people don't believe they can do this analysis themselves. Some of that…
DP World Tour Betting Tips
The most reliable source of value I have found in golf betting over nine years is not the Masters or…
